
Eighty-Three Per Cent Full
Spain's grid-capacity maps have gone from a scattered afterthought to a live, monthly intelligence feed. For anyone hunting a home for a data centre, learning to read them is now the difference between a permit and a forfeited deposit.

For years, applying to plug a large new load into Spain's electricity grid was an act of faith. A developer would pick a substation, lodge a request, post a guarantee, and wait — with no more idea of what lay behind the wires than a driver guessing at traffic on a road he cannot see. "Requests were made completely blind," Lidia Fernández, a senior associate at the law firm Watson Farley & Williams, told an ATA Insights webinar. "You had no information and no visibility about where there was capacity."
That era is over. Since September 2025, Spain's distribution companies have been obliged to publish maps of the firm demand capacity available at each node of their networks. As of April 2026, the national regulator, the CNMC, has gone a step further and stitched the scattered files together into a single, interactive, monthly-updated map of the whole country — generation and demand, transmission and distribution, filterable by province, voltage and technology. The blindfold has come off.
What the map reveals is not comforting. According to AELEC, the association of Spain's large distributors, 83.4 per cent of distribution nodes are now saturated: there is simply no room to connect new demand. In several regions the picture is worse still. Speaking at the webinar, Daniel Vargas, senior regulation expert at AELEC, put roughly 84 per cent of nodes in the "cannot connect" column and singled out La Rioja, the Basque Country and Navarre, "where more than 90 per cent of nodes are already saturated." The country, in short, is nearly full.
And yet the same map that delivers that grim headline is also the single most useful tool a data-centre developer has acquired in a decade. The trick is knowing how to read it.
From blind bet to informed hunt
The maps are, technically, not maps. "We call them maps," Fernández noted, "but depending on the distributor the format is either a PDF or an Excel — and I prefer the Excel, because you can filter. These are infinite spreadsheets, with a huge amount of information, and it lets you actually work with the data."
That data is granular. Each node carries its distributor code, province and municipality, the substation's coordinates and unique identifier, and its voltage level. Then come the numbers that matter. The column a developer will stare at first is firm capacity available — the headroom, in megawatts, that a new demand request could actually claim. Beside it sit its shadows: capacity already occupied by granted permits, capacity tied up in requests still under study, and capacity frozen for regulatory reasons, such as nodes caught up in a public tender.
There is also a category worth learning by name: the "zero-asterisk" node. These are nodes with no capacity in the current scenario, Vargas explained, "but which could obtain it conditionally on the execution of reinforcements in the distribution network" — provided the works are compatible with the timing of the access permits. A zero-asterisk is not a dead end; it is a maybe, and a developer who understands the difference between a hard zero and a conditional one is already ahead of the field.
Two warnings come attached. First, the maps are a snapshot, refreshed at least monthly, and the picture at any node moves. It can shift because a higher-priority request ahead of you in the queue has been processed, or because new plant has come into service. Read last month's map and you may be siting a project on capacity that no longer exists. Second — and this trips up newcomers — you cannot simply add up the "available capacity" column to estimate a node's total headroom. Different voltage levels at the same substation are interconnected, Vargas cautioned, so capacity granted at one level subtracts from another, "but not in the same proportion." The spreadsheet rewards the patient and punishes the arithmetically hasty.
The map has teeth
Here is where reading the map stops being good practice and becomes self-defence. Under the old blind regime, the rational move was to fire off requests everywhere and hope — carpet-bomb the network and see what stuck. That instinct now carries a price.
Article 8.3 of Royal Decree 1183/2020 — a clause "every renewable producer keeps very much in mind," as Fernández put it — allows the partial execution of a developer's financial guarantee when a request lands on a node with zero grantable capacity. Lodge such a request and, instead of a clean refund, you may get back only 80 per cent of your deposit; the other 20 per cent is forfeit. The rule was written to stop avalanches of unviable filings on nodes everyone already knew were full.
The defence is straightforward once you know it exists. The 20-per-cent bite applies only if there was genuinely no grantable capacity at the moment you constituted your guarantee. If you can show that, at eight in the morning on the day you posted it, the published map showed headroom that later vanished during the sluggish guarantee-validation process, you are protected. In other words: check the map, save the map, note the date. "Now that we have this information," Fernández warned, "you cannot keep doing what was done until now — filing requests anywhere, just in case." The tool that opens the door also disarms the mine in front of it.
There is a live legal wrinkle worth flagging. Article 8.3 was drafted with generation in mind, back when demand requests did not even carry guarantees, and it still speaks the language of generation tenders. Fernández's firm has fielded a stream of queries asking whether it bites on demand at all. Her reading is that it does — the article is not limited to generation, and the omission of demand looks like incomplete legislative housekeeping rather than a deliberate carve-out. "The same rationale applies now," she argued. Developers hoping the clause conveniently skips demand are, on her assessment, betting against the spirit of the rule.
Why the grid ran out of room
The saturation did not appear from nowhere, and the numbers explain both the crunch and the opportunity buried inside it. Vargas cited figures the energy ministry, MITECO, presented alongside its draft royal decree on network investment plans: some 43 gigawatts of demand access were granted across 2020 to 2024 — a large slice of it for industry and data centres, but also for housing developments, storage and EV charging. Then came the tell. In 2024 alone, distributors received demand access requests totalling 67 gigawatts — more in a single year than was granted in the previous four combined, and equivalent to roughly 40 per cent of all the power currently contracted in Spain.
Demand, in short, has arrived faster than the network can be reinforced to meet it. The proportion of requests being refused, mostly for lack of capacity, is "growing at double-digit rates," Vargas said, and now represents around half of the capacity requested in 2024. His framing was blunt about the stakes: fail to serve industrial and data-centre demand in time, and "this country opportunity will not materialise."
That is the pessimist's reading. The optimist's is that a wave of regulation now in the pipeline is aimed squarely at prising the network open — and a developer who tracks it can position ahead of the pack. MITECO's investment-plan decree would lift the investment ceilings that have throttled network build-out for years. A consultation is running on flexible access permits, which would let loads that do not need round-the-clock firm supply share capacity rather than hoarding it — freeing firm headroom for those who genuinely require it. And detail specifications for firm demand capacity on the transmission network, not just distribution, have just cleared their public-hearing stage. "The connection story for demand does not end here," Fernández said. "There are opportunities, and the framework is developing."
The fine print that decides projects
For data centres specifically, two details in the emerging rules deserve a place on every developer's checklist — because they can quietly decide whether a permit survives.
The first is the "same-installation" test. To keep a demand permit today, you may not shift the geometric centre of the load by more than ten kilometres. The draft decree would add two more constraints: a bar on changing the activity code, and a bar on cutting requested capacity by more than half. The activity-code rule matters more than it sounds. As Fernández put it, you cannot "ask for a permit for a shoe factory and tomorrow want to change it to a data centre." Even before the rule is formally in force, she cautioned, CNMC resolutions already treat a wholesale change in the nature of the supply as a substantial modification — one that may demand a fresh permit rather than a quiet update. Buying a permit and swapping in a data centre later is not the loophole it looks like.
The second is a straightforward disadvantage. The rules for the first transmission-node demand tenders give explicit priority to renewable hydrogen and gases, and to the electrification of industry and mining — ahead of data centres. "This is a relevant issue for those of you thinking about obtaining access for data centres within these tenders," Fernández noted, "because it will have its impact." In a contest for scarce nodes, a data centre starts a step behind. Knowing that in advance is the difference between a strategy and a surprise.
None of this changes the one iron rule the maps do not repeal: a published map never removes the need for a node-specific study. Every request still triggers its own technical assessment by the distributor. The map tells you where to look; it does not sign the permit.
Reading the room
The temptation, faced with an 83.4-per-cent-full grid, is to conclude that Spain is closed for business. That is the wrong lesson. The right one is that the country has, almost overnight, handed developers a piece of competitive intelligence their competitors are still learning to use. The headroom exists — thinly, unevenly, moving month to month, hiding in zero-asterisk nodes and in the regulatory reforms now inching through consultation. It rewards whoever reads the map first, saves the timestamp, and files where the capacity actually is rather than where they wish it were.
The blindfold is off. What a developer does in the first minute of clear sight is now the whole game.
The full webinar — "Nuevo marco CNMC: cómo interpretar los mapas de capacidad y ganar ventaja competitiva" — is available to watch on demand from ATA Insights. The conversation continues in person at RENMAD Datacenters in Zaragoza.
You reached this analysis because ATA Insights puts independent energy-transition intelligence in front of 86,000+ professionals across the sector. That's exactly what we do for funded projects, events and companies — turn your work into reach.
See how we disseminate work like this →Where this analysis came from
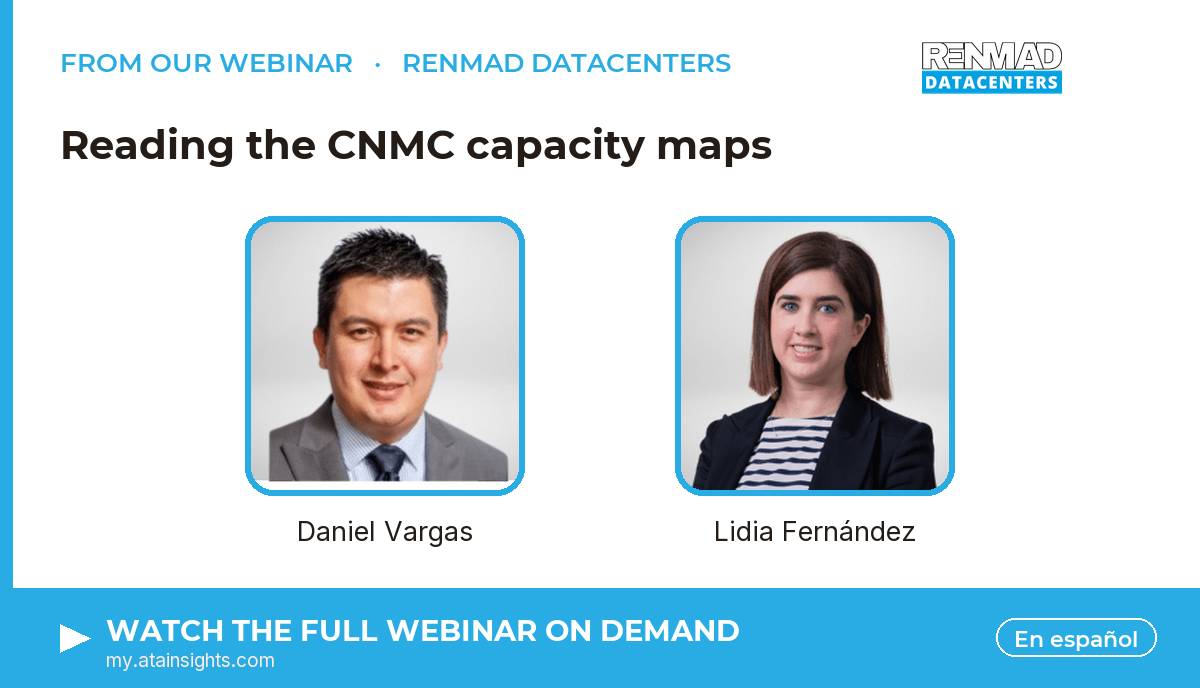
This piece draws on the ATA Insights / RENMAD webinar Reading the CNMC capacity maps. Watch the full session on demand.
The energy transition, in your inbox
Join 86,000+ professionals reading our independent briefings across five sectors.